
Visualising a Keras Model in Tensorboard
In this blog, we will be visualising a Keras deep learning model in Tensorboard.
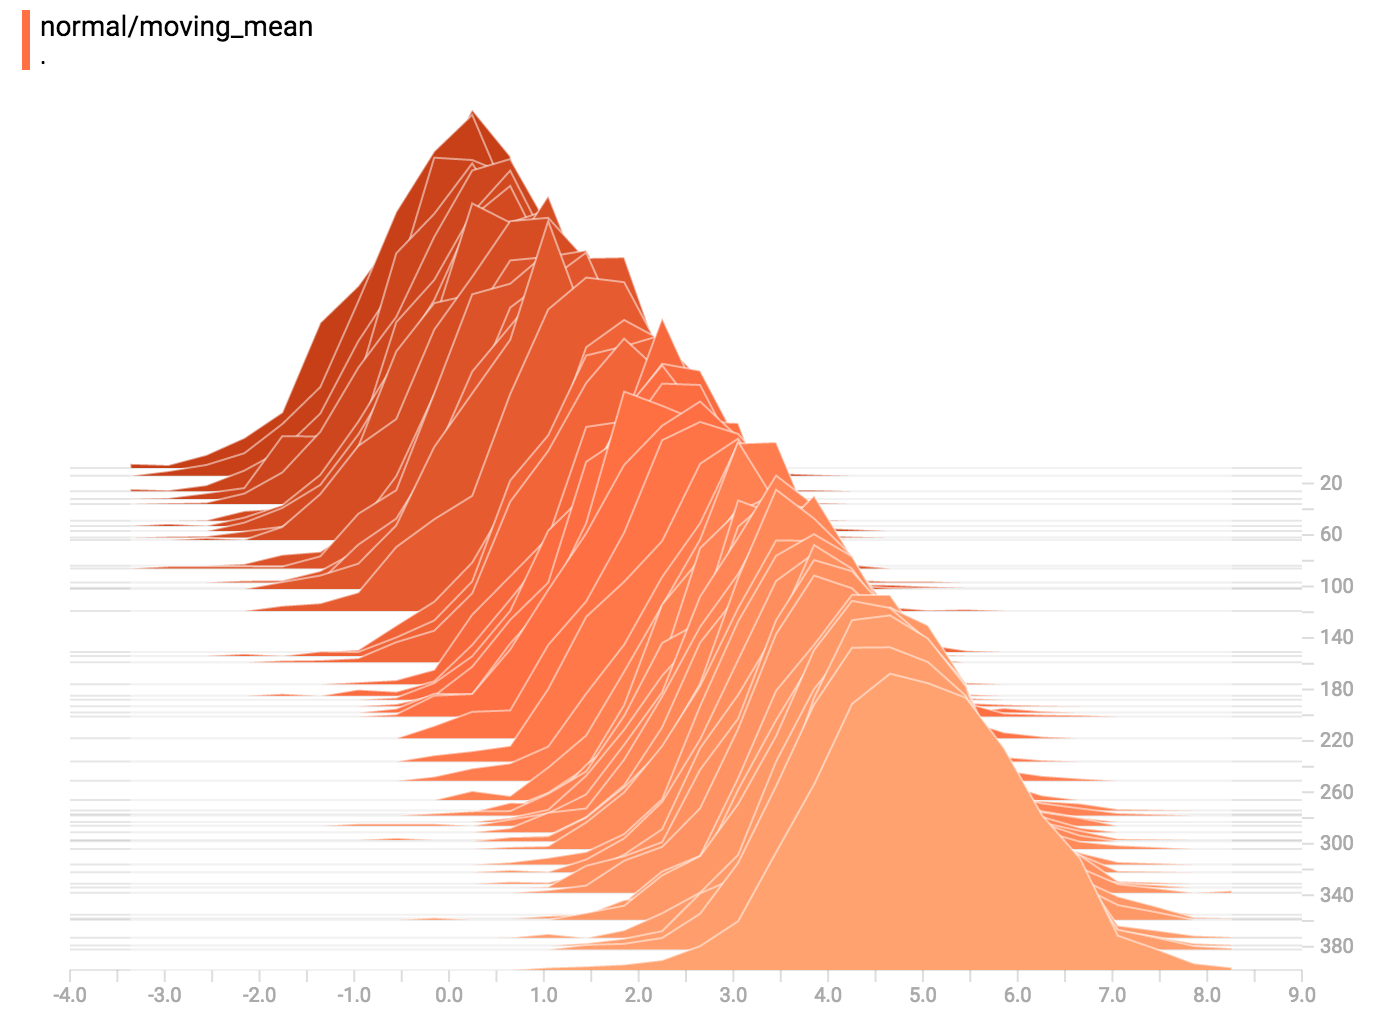
Tensorboard is a very nice platform provided by Google to visualise our machine learning models in the forms of graphs. We can visualise the model structure, metric graphs and many other things in a cool way here.
Since it is for TensorFlow graphs, I found it cool that it can also work for Keras models. But the Keras code should be written in TensorFlow backend.
Let us quickly dive into the coding part:
I will be writing a simple Keras model and show you how to visualise it in Tensorboard.
We will do all the necessary imports first:
import tensorflow.keras as keras
import pandas as pd
import numpy as np
from tensorflow.keras.models import Model
from sklearn.model_selection import train_test_split
from tensorflow.keras.models import load_model as load_model
from tensorflow.keras.models import save_model as save_model
Now we will create a simple text-classifier model:
import tensorflow.keras as keras
from tensorflow.keras.layers import Embedding
from tensorflow.keras.models import Model


embedding_layer_desc = Embedding(vocab_length, 300,
                                 input_length=9, trainable=True)
inp = keras.Input(shape=(9,), dtype='int32')
seq = embedding_layer_desc(inp)


conv1 = keras.layers.Conv1D(filters=32, kernel_size=2, activation='relu')(seq)
drop1 = keras.layers.Dropout(0.3)(conv1)


conv2 = keras.layers.Conv1D(filters=64, kernel_size=3, activation='relu')(seq)
drop2 = keras.layers.Dropout(0.3)(conv2)


conv3 = keras.layers.Conv1D(filters=32, kernel_size=4, activation='relu')(seq)
drop3 = keras.layers.Dropout(0.3)(conv3)


flat1 = keras.layers.Flatten()(drop1)
flat2 = keras.layers.Flatten()(drop2)
flat3 = keras.layers.Flatten()(drop3)


merged = keras.layers.concatenate([flat1, flat2, flat3])
dense1 = keras.layers.Dense(128, activation='relu')(merged)
outputs = keras.layers.Dense(num_classes, activation='softmax')(dense1)
model = keras.Model(desc_inp, outputs=outputs)
The graph is created when the model gets compiled. So just after creating the graph we will define our Tensorboard callback as follows:
adam = tf.keras.optimizers.Adam(lr=0.001)
model.compile(loss='categorical_crossentropy', optimizer='adam', metrics=['acc'])

logdir= "/home/praphul/tensorboard/cnnnlp/"
tensorboard_callback = keras.callbacks.TensorBoard(log_dir=logdir)


for i in range(epochs):
    model.fit(X,Y, epochs=1,validation_split=0.1,callbacks=[tensorboard_callback], batch_size=32)
    save_model(model, '/home/praphul/saved_models/cnnnlp.h5')
Now we will train the model:
We will switch to the terminal now and run the following command with the same log directory given in the code:
$ tensorboard --logdir=your_log_dir
Generally, the tensorboard starts on the 6006 port. Go to any browser in your system and type the port number followed by localhost or the public IP of the remote system you are working on.
Hurray! We are ready with our keras-tensorboard visualisation.
Keep Learning, Keep Sharing 😊